

Histogram showing the effect of increasing formalin concentration on paw movements in the rat
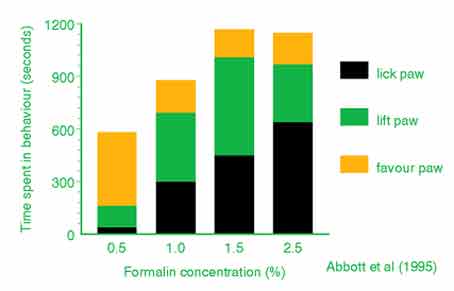
During the second phase (30 to 50 minutes after a formalin injection into a rear paw), there was an increase in the time spent paw licking and lifting with an increase in formalin concentration from 0.5% to 2.5%. Paw favouring was important in identification of pain at low intensities.
Time spent licking and lifting was about 180 seconds for 0.5%; 690 sec for 1%; 1080 sec for 1.5% and 960 sec for 2.5%. Paw licking increased from about 30 sec at 0.5% formalin, 300 sec at 1%, 450 at 1.5% to 650 sec at 2.5% formalin. Times spent paw favouring were 420 sec at 0.5% and about 250 sec for the other concentrations of formalin.
There was a strong correlation between the log concentration of formalin and paw licking (r=0.77), paw lifting (r=0.48) and a combination of the two activities (r=0.84).